

SciChart Examples app for iPhone and iPad
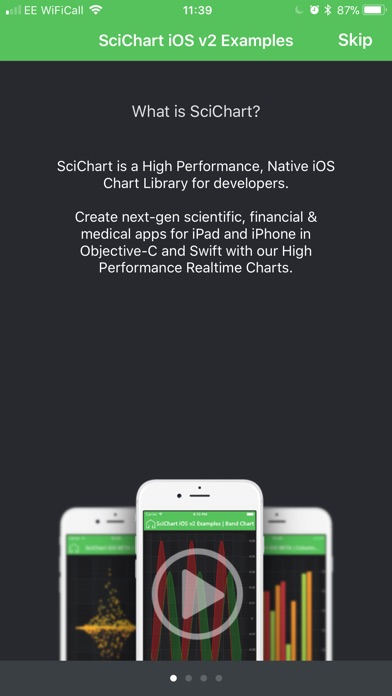
SciChart is a high-performance Chart Library aimed at Objective-C, Swift and Xamarin developers who wish to create stunning, interactive charting apps on the iPhone or iPad devices.
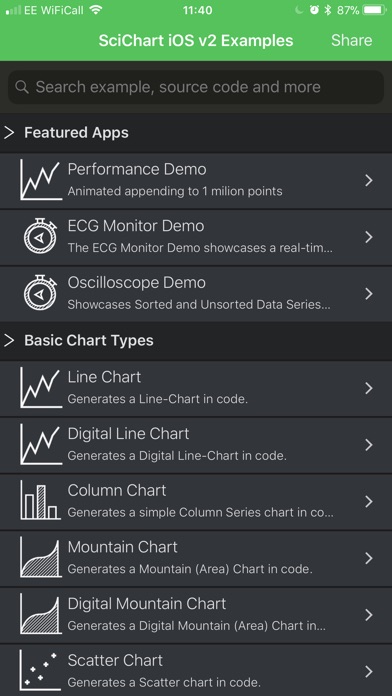
This application shows scenarios developers can achieve using the SciChart SDK. Browse the examples to see what SciChart can do. A source code preview is available for every example.
SciCharts Examples demonstrate our high performance, realtime
- Line Charts
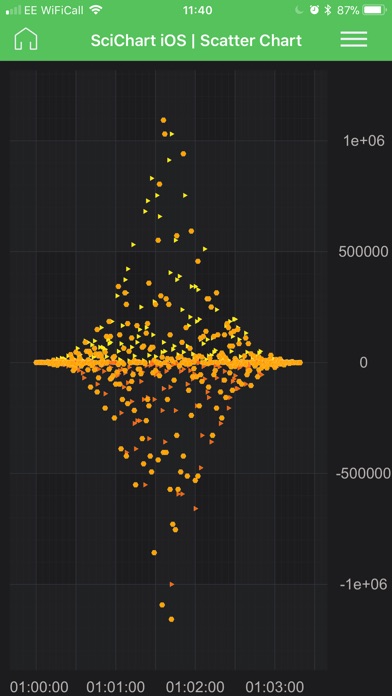
- Scatter Charts
- Column Charts
- Mountain (Area) Charts
- Candlestick Charts
- OHLC Charts
- Error Bars
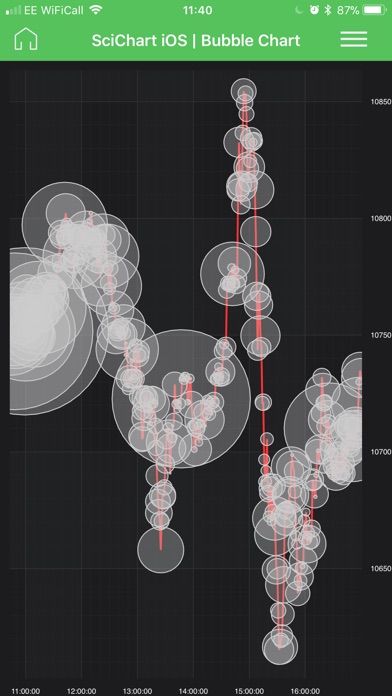
- Bubble Charts
- Heatmap Charts
- Stacked Column Charts
- Stacked Bar Charts
- Stacked Mountain Charts
- Fan Charts
- Impulse (Stem) Charts
- Point-Line Charts
- Digital (Step) Line Charts
- Digital (Step) Mountain Charts
- Digital (Step) Band Charts
- Pie Charts
- Donut Charts
Extreme realtime Performance.
Used by scientists, engineers and traders, the SciChart Chart component allows visualising hundreds of thousands, or millions of data-points in real-time. A feat no other chart component can do!
Unlimited X & Y Axis
SciChart features unlimited, left, right, top or bottom X and Y Axis, with multiple different axis types, including Category Axis, Value Axis, Logarithmic Axis, and Date Axis.
Annotations and Markers
Overlay text, line, boxes and custom annotations and markers on the chart. Interact with annotations via touch to reposition them.
Styling & Themeing
Ships with 8 stunning themes in a Theme Manager, which you can apply to your charts with a single line of code. Creation of custom themes via .plist or in code.
Extensible, Customisable API
An API built by developers for developers. Customize SciChart in your application by overriding API endpoints.